Plot experience study results
Usage
# S3 method for class 'exp_df'
autoplot(
  object,
  ...,
  x = NULL,
  y = NULL,
  color = NULL,
  mapping,
  second_axis = FALSE,
  second_y = NULL,
  scales = "fixed",
  geoms = c("lines", "bars", "points"),
  y_labels = scales::label_percent(accuracy = 0.1),
  second_y_labels = scales::label_comma(accuracy = 1),
  y_log10 = FALSE,
  conf_int_bars = FALSE
)

# S3 method for class 'trx_df'
autoplot(
  object,
  ...,
  x = NULL,
  y = NULL,
  color = NULL,
  mapping,
  second_axis = FALSE,
  second_y = NULL,
  scales = "fixed",
  geoms = c("lines", "bars", "points"),
  y_labels = scales::label_percent(accuracy = 0.1),
  second_y_labels = scales::label_comma(accuracy = 1),
  y_log10 = FALSE,
  conf_int_bars = FALSE
)
Arguments
- object
An object of class
exp_dfcreated by the functionexp_stats()or an object of classtrx_dfcreated by the functiontrx_stats().- ...
Faceting variables passed to
ggplot2::facet_wrap().- x
An unquoted column name in
objector expression to use as thexvariable.- y
An unquoted column name in
objector expression to use as theyvariable. If unspecified,ywill default to the observed termination rate (q_obs) forexp_dfobjects and the observed utilization rate (trx_util) fortrx_dfobjects.- color
An unquoted column name in
objector expression to use as thecolorandfillvariables.- mapping
Aesthetic mapping passed to
ggplot2::ggplot(). NOTE: Ifmappingis supplied, thex,y, andcolorarguments will be ignored.- second_axis
Logical. If
TRUE, the variable specified bysecond_y(default = exposure) is plotted on a second y-axis using an area geometry.- second_y
An unquoted column name in
objectto use as theyvariable on the second y-axis. If unspecified, this will default toexposure.- scales
The
scalesargument passed toggplot2::facet_wrap().- geoms
Type of geometry. If "lines" is passed, the plot will display lines and points. If "bars", the plot will display bars. If "points", the plot will display points only.
- y_labels
Label function passed to
ggplot2::scale_y_continuous().- second_y_labels
Same as
y_labels, but for the second y-axis.- y_log10
If
TRUE, the y-axes are plotted on a log-10 scale.- conf_int_bars
If
TRUE, confidence interval error bars are included in the plot. Forexp_dfobjects, this option is available for termination rates and actual-to-expected ratios. Fortrx_dfobjects, this option is available for utilization rates and anypct_ofcolumns.
Details
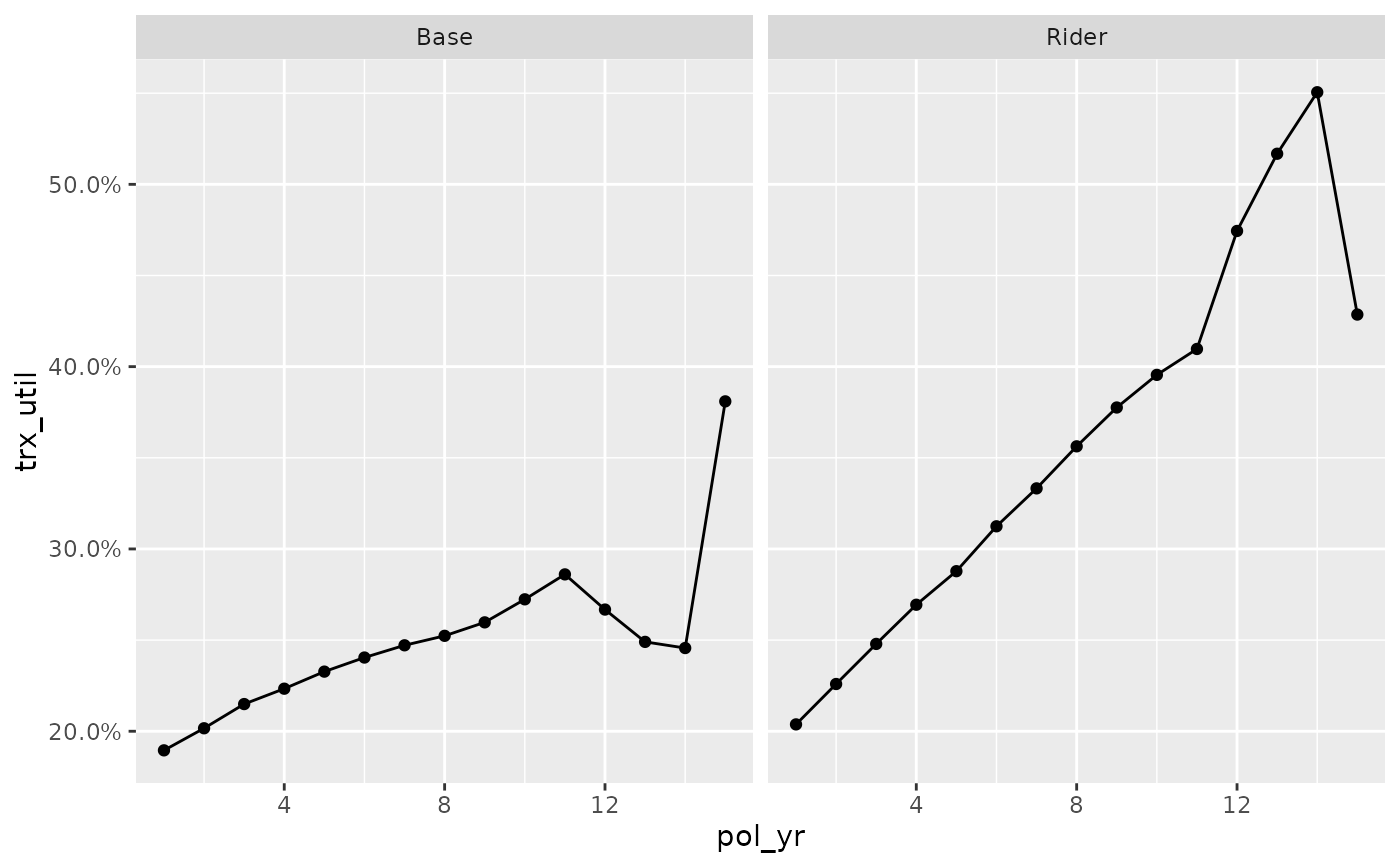
If no aesthetic map is supplied, the plot will use the first
grouping variable in object on the x axis and q_obs on the y
axis. In addition, the second grouping variable in object will be
used for color and fill.
If no faceting variables are supplied, the plot will use grouping
variables 3 and up as facets. These variables are passed into
ggplot2::facet_wrap(). Specific to trx_df objects, transaction
type (trx_type) will also be added as a faceting variable.