Create a summary of termination experience for a given target status (an ExpStats object).
Typically, the ExpStats class constructor should not be called directly. The preferred method for creating an ExpStats object is to call the exp_stats() method on an ExposedDF object.
Parameters
Name
Type
Description
Default
expo
actxps.expose.ExposedDF
An exposed data frame class
required
target_status
str | list | numpy.numpy.ndarray
A single string, list, or array of target status values
None
expected
str | list | numpy.numpy.ndarray
Single string, list, or array of column names in the data property of expo with expected values
None
wt
str
Name of the column in the data property of expo containing weights to use in the calculation of claims, exposures, and partial credibility.
None
conf_int
bool
If True, the output will include confidence intervals around the observed termination rates and any actual-to-expected ratios.
False
credibility
bool
Whether the output should include partial credibility weights and credibility-weighted decrement rates.
False
conf_level
float
Confidence level under the Limited Fluctuation credibility method and confidence intervals
0.95
cred_r
float
Error tolerance under the Limited Fluctuation credibility method
0.05
col_exposure
str
Name of the column in data containing exposures.
'exposure'
Attributes
Name
Type
Description
data
polars.polars.DataFrame
A data frame containing experience study summary results that includes columns for any grouping variables, claims, exposures, and observed decrement rates (q_obs). If any values are passed to expected, additional columns will be added for expected decrements and actual-to-expected ratios. If credibility is set to True, additional columns are added for partial credibility and credibility-weighted decrement rates (assuming values are passed to expected).
Metadata about the experience study inferred from the ExposedDF object (expo) or passed directly to ExpStats.
Notes
If expo is grouped (see the ExposedDF.group_by() method), the returned ExpStats object’s data will contain one row per group.
If nothing is passed to target_status, the target_status property of expo will be used. If that property is None, all status values except the first level will be assumed. This will produce a warning message.
Expected values
The expected argument is optional. If provided, this argument must be a string, list, or array with values corresponding to columns in expo.data containing expected experience. More than one expected basis can be provided.
Confidence intervals
If conf_int is set to True, the output will contain lower and upper confidence interval limits for the observed termination rate and any actual-to-expected ratios. The confidence level is dictated by conf_level. If no weighting variable is passed to wt, confidence intervals will be constructed assuming a binomial distribution of claims. Otherwise, confidence intervals will be calculated assuming that the aggregate claims distribution is normal with a mean equal to observed claims and a variance equal to:
Var(S) = E(N) * Var(X) + E(X)**2 * Var(N),
Where S is the aggregate claim random variable, X is the weighting variable assumed to follow a normal distribution, and N is a binomial random variable for the number of claims.
If credibility is True and expected values are passed to expected, the output will also contain confidence intervals for any credibility-weighted termination rates.
Credibility
If credibility is set to True, the output will contain a credibility column equal to the partial credibility estimate under the Limited Fluctuation credibility method (also known as Classical Credibility) assuming a binomial distribution of claims.
Alternative class constructor
ExpStats.from_DataFrame() can be used to coerce a data frame containing pre-aggregated experience into an ExpStats object. This is most useful for working with industry study data where individual exposure records are not available.
See Also
Herzog, Thomas (1999). Introduction to Credibility Theory
Convert a data frame containing aggregate termination experience study results to the ExpStats class.
from_DataFrame() is most useful for working with aggregate summaries of experience that were not created by actxps where individual policy information is not available. After converting the data to the ExpStats class, summary() can be used to summarize data by any grouping variables, and plot() and table() are available for reporting.
A DataFrame containing aggregate experience study results. See the Notes section for required columns that must be present.
required
target_status
str | list | numpy.numpy.ndarray
Target status values
None
expected
str | list | numpy.numpy.ndarray
Column names in x with expected values.
None
wt
str
Name of the column in data containing weights to use in the calculation of claims, exposures, partial credibility, and confidence intervals.
None
conf_int
bool
If True, future calls to summary() will include confidence intervals around the observed termination rates and any actual-to-expected ratios.
False
credibility
bool
If True, future calls to summary() will include partial credibility weights and credibility-weighted termination rates.
False
conf_level
float
Confidence level used for the Limited Fluctuation credibility method and confidence intervals.
0.95
cred_r
float
Error tolerance under the Limited Fluctuation credibility method.
0.05
col_claims
str
Name of the column in data containing claims.
'claims'
col_exposure
str
Name of the column in data containing exposures.
'exposure'
col_n_claims
str
Only used used when wt is passed. Name of the column in data containing the number of claims.
'n_claims'
col_weight_sq
default=’weight_sq
Only used used when wt is passed. Name of the column in data containing the sum of squared weights.
'weight_sq'
col_weight_n
str
Only used used when wt is passed. Name of the column in data containing exposure record counts.
'weight_n'
start_date
datetime.date | str
Experience study start date
date(1900, 1, 1)
end_date
date | str: default=None
Experience study end date
None
Returns
Type
Description
actxps.exp_stats.ExpStats
An ExpStats object
Notes
If nothing is passed to wt, the data frame data must include columns containing:
Exposures (exposure)
Claim counts (claims)
If wt is passed, the data must include columns containing:
Weighted exposures (exposure)
Weighted claims (claims)
Claim counts (n_claims)
The raw sum of weights NOT multiplied by exposures
Exposure record counts (.weight_n)
The raw sum of squared weights (.weight_sq)
The names in parentheses above are expected column names. If the data frame passed to from_DataFrame() uses different column names, these can be specified using the col_* arguments.
When a column name is passed to wt, the columns .weight, .weight_n, and .weight_sq are used to calculate credibility and confidence intervals. If credibility and confidence intervals aren’t required, then it is not necessary to pass anything to wt. The resulting ExpStats class and any downstream summaries will still be weighted as long as the exposures and claims are pre-weighted.
target_status, start_date, and end_date are optional arguments that are only used for printing the resulting ExpStats object.
Examples
import actxps as xp# convert pre-aggregated experience into an ExpStats objectagg_sim_dat = xp.load_agg_sim_dat()dat = xp.ExpStats.from_DataFrame( agg_sim_dat, col_exposure="exposure_n", col_claims="claims_n", target_status="Surrender", start_date=2005, end_date=2019, conf_int=True)# summary by policy yeardat.summary('pol_yr')# repeat the prior exercise on a weighted basisdat_wt = xp.ExpStats.from_DataFrame( agg_sim_dat, wt="av", col_exposure="exposure_amt", col_claims="claims_amt", col_n_claims="claims_n", col_weight_sq="av_sq", col_weight_n="n", target_status="Surrender", start_date=2005, end_date=2019, conf_int=True)# summary by policy yeardat_wt.summary('pol_yr')
ExposedDF.exp_stats() for information on how ExpStats objects are typically created from individual exposure records.
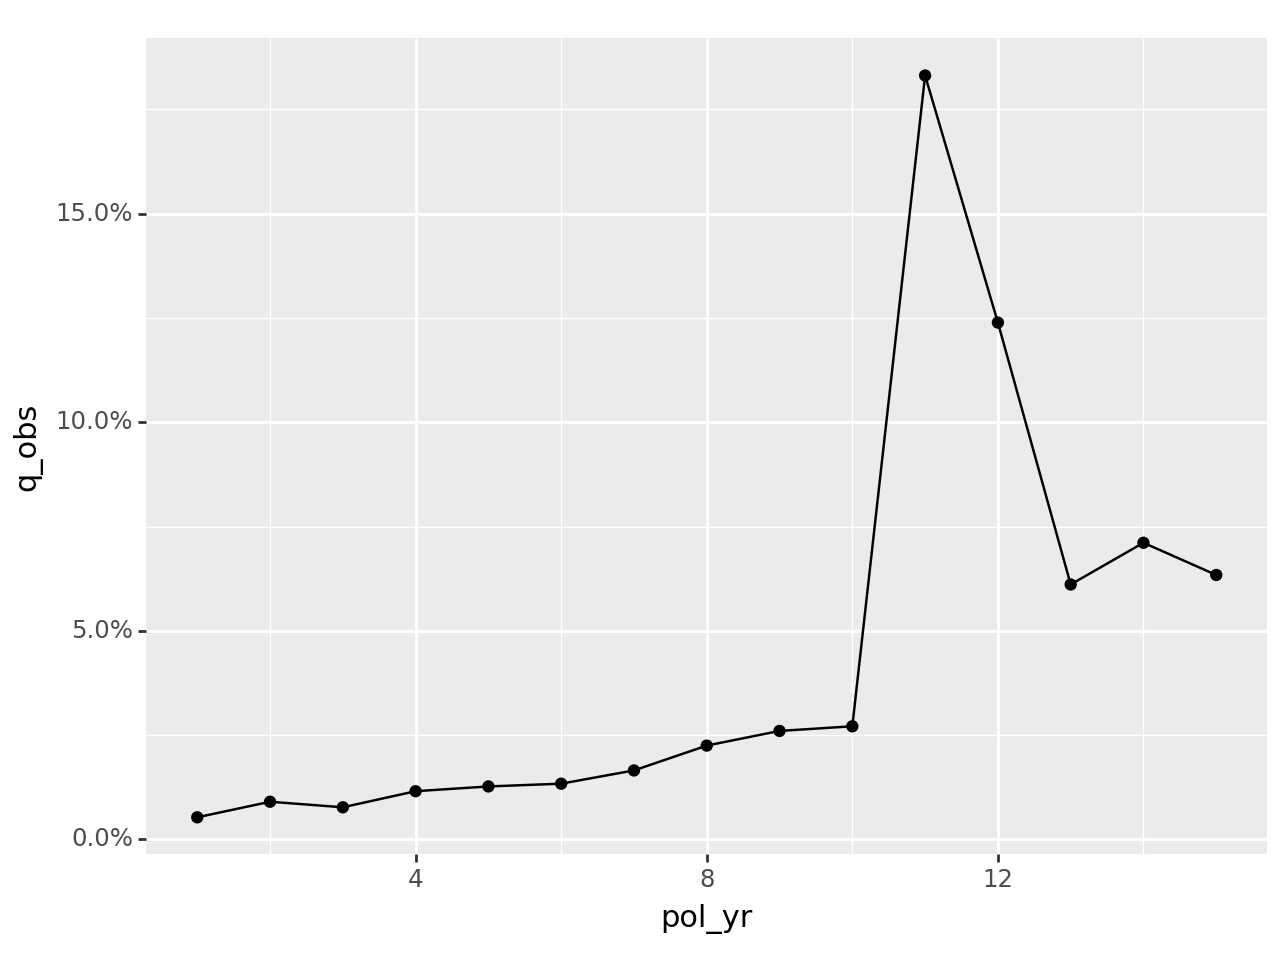
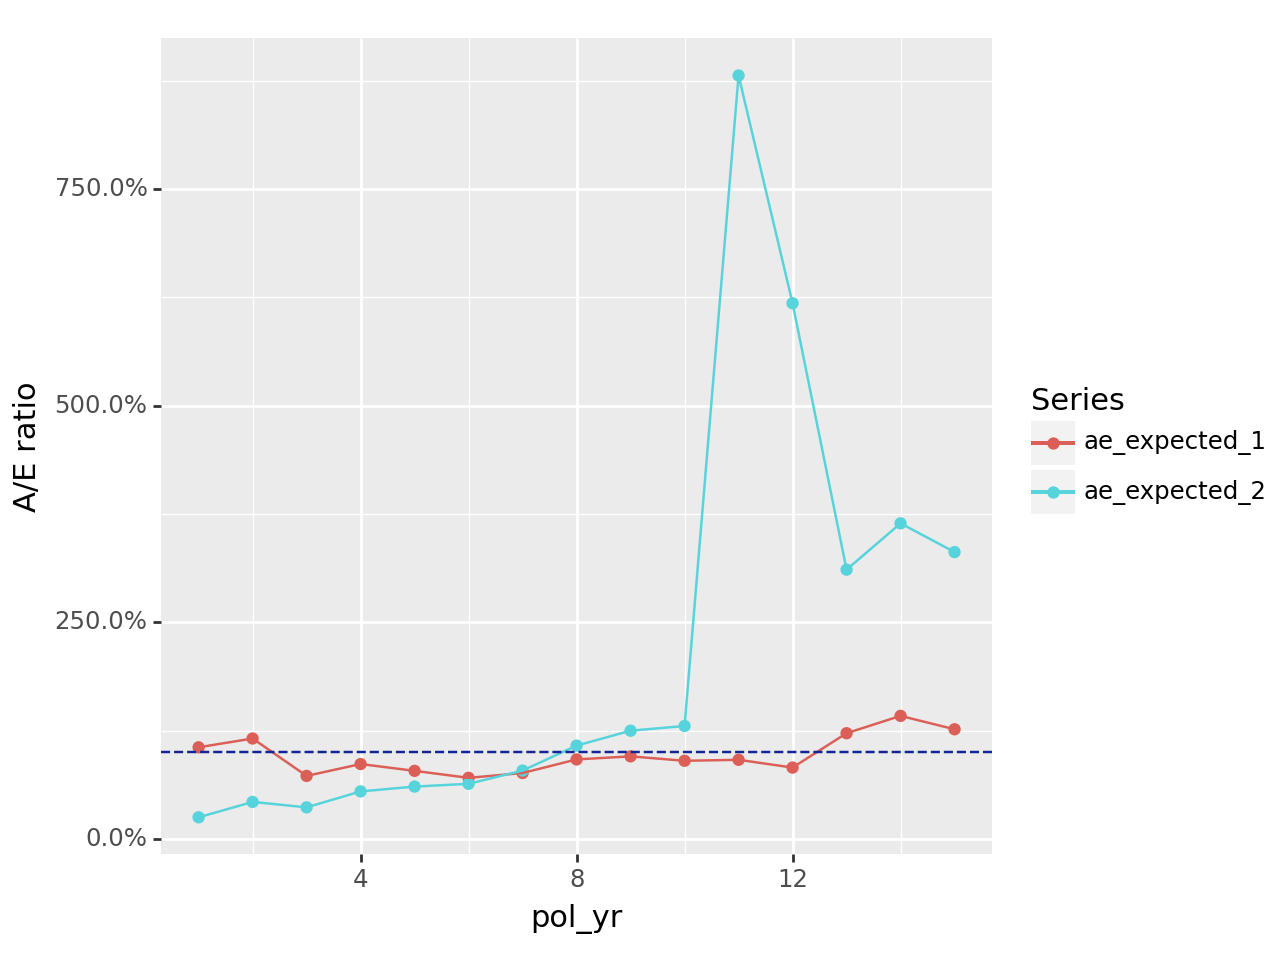
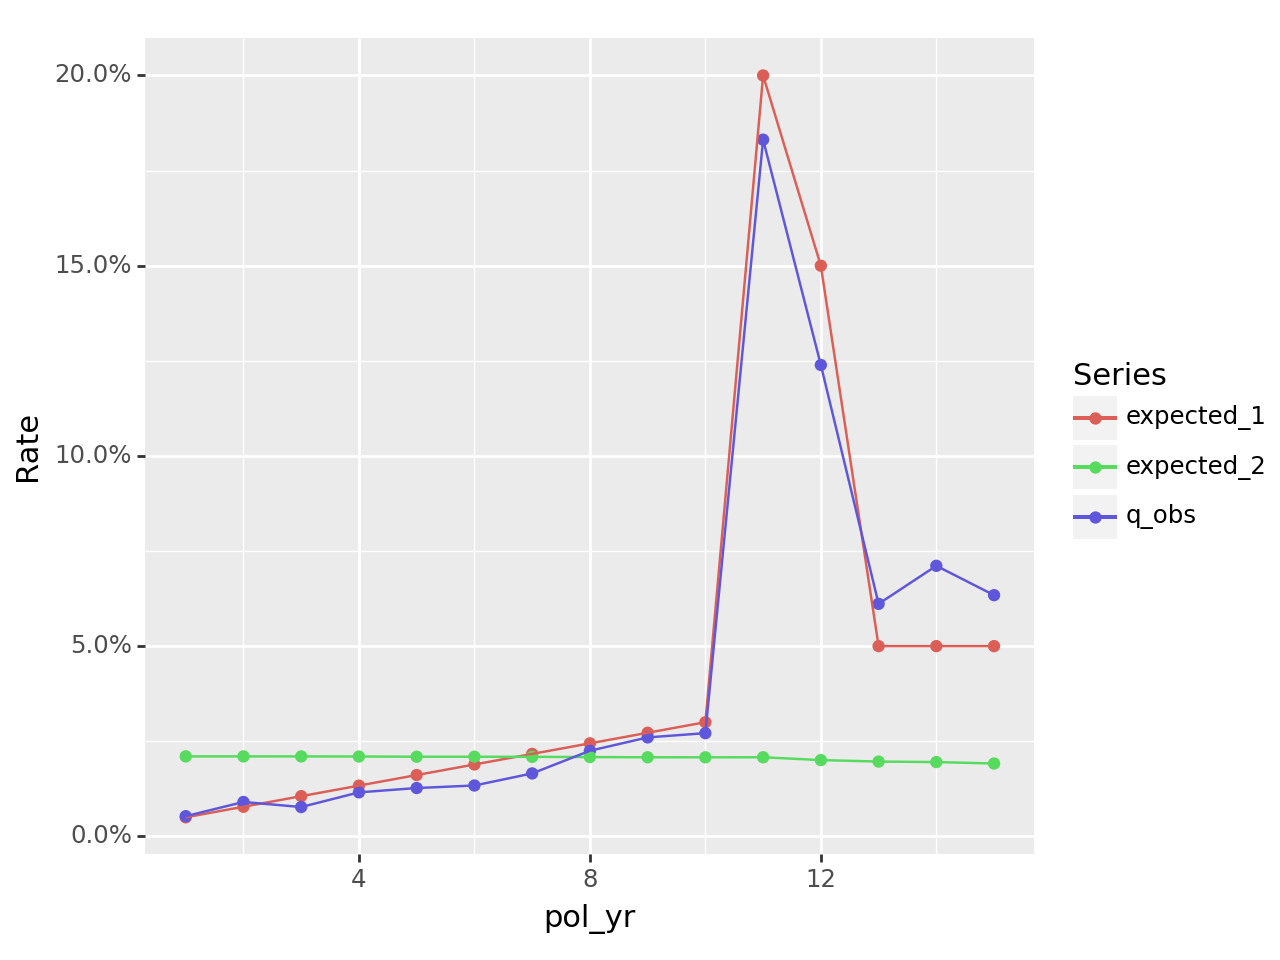
plot
exp_stats.ExpStats.plot(x=None, y='q_obs', color=None, facets=None, mapping=None, scales='fixed', geoms='lines', y_labels=lambda : [f'{v * 100}%' for v in l], y_log10=False, conf_int_bars=False)
Plot experience study results
Parameters
Name
Type
Description
Default
x
str
A column name in data to use as the x variable. If None, x will default to the first grouping variable. If there are no grouping variables, x will be set to “All”.
None
y
str
A column name in data to use as the y variable.
'q_obs'
color
str
A column name in data to use as the color and fill variables. If None, y will default to the second grouping variable. If there are less than two grouping variables, the plot will not use a color aesthetic.
None
facets
list | str
Faceting variables in data passed to plotnine.facet_wrap(). If None, grouping variables 3+ will be used (assuming there are more than two grouping variables).
None
mapping
plotnine.aes
Aesthetic mapping added to plotnine.ggplot(). NOTE: If mapping is supplied, the x, y, and color arguments will be ignored.
None
scales
str
The scales argument passed to plotnine.facet_wrap().
'fixed'
geoms
(lines, bars, points)
Type of geometry. If “lines” is passed, the plot will display lines and points. If “bars”, the plot will display bars. If “points”, the plot will display points only.
'lines'
y_labels
callable
Label function passed to plotnine.scale_y_continuous().
lambda l: [f"{v * 100:.1f}%" for v in l]
y_log10
bool
If True, the y-axes are plotted on a log-10 scale.
False
conf_int_bars
bool
If True, confidence interval error bars are included in the plot. This option is only available for termination rates and actual-to-expected ratios.
False
Notes
If no aesthetic map is supplied, the plot will use the first grouping variable in the groups property on the x axis and q_obs on the y axis. In addition, the second grouping variable in groups will be used for color and fill.
If no faceting variables are supplied, the plot will use grouping variables 3 and up as facets. These variables are passed into plotnine.facet_wrap().
Examples
import actxps as xpexp_res = (xp.ExposedDF(xp.load_census_dat(),"2019-12-31", target_status="Surrender"). group_by('pol_yr'). exp_stats())exp_res.plot()
Re-summarize the data while retaining any grouping variables passed to the *by argument.
Parameters
Name
Type
Description
Default
*by
tuple
Quoted column names in data that will be used as grouping variables in the re-summarized object. Passing nothing is acceptable and will produce a 1-row experience summary.
()
Returns
Type
Description
actxps.exp_stats.ExpStats
A new ExpStats object with rows for all the unique groups in *by
Examples
import actxps as xpexp_res = (xp.ExposedDF(xp.load_census_dat(),"2019-12-31", target_status="Surrender"). group_by('pol_yr', 'inc_guar'). exp_stats())exp_res.summary('inc_guar')
Convert experience study results to a presentation-friendly format.
Parameters
Name
Type
Description
Default
fontsize
int
Font size percentage multiplier
100
decimals
int
Number of decimals to display for percentages
1
colorful
bool
If True, color will be added to the the observed decrement rate and actual-to-expected columns.
True
color_q_obs
str or colormap
ColorBrewer palette used for the observed decrement rate.
'GnBu'
color_ae_
str or colormap
ColorBrewer palette used for actual-to-expected rates.
'RdBu'
show_conf_int
bool
If True any confidence intervals will be displayed.
False
show_cred_adj
bool
If True any credibility-weighted termination rates will be displayed.
False
decimals_amt
int
Number of decimals to display for amount columns (number of claims, claim amounts, and exposures.
0
suffix_amt
bool
This argument has the same meaning as the compact argument in great_tables.gt.GT.fmt_number() for amount columns. If False, no scaling or suffixing are applied to amount columns. If True, all amount columns are automatically scaled and suffixed by “K” (thousands), “M” (millions), “B” (billions), or “T” (trillions).
False
rename_cols
str
Key-value pairs where keys are column names and values are labels that will appear on the output table. This parameter is useful for renaming grouping variables that will appear under their original variable names if left unchanged.
None
Notes
Further customizations can be added using great_tables.gt.GT methods. See the great_tables package documentation for more information.