Create a summary of transaction counts, amounts, and utilization rates (a TrxStats object).
Typically, the TrxStats class constructor should not be called directly. The preferred method for creating a TrxStats object is to call the trx_stats() method on an ExposedDF object.
Parameters
Name
Type
Description
Default
expo
actxps.expose.ExposedDF
An exposed data frame class
required
trx_types
list or str
A list of transaction types to include in the output. If None is provided, all available transaction types in the trx_types property of expo will be used.
None
percent_of
list | str
A optional list containing column names in the data property of expo to use as denominators in the calculation of utilization rates or actual-to-expected ratios.
None
combine_trx
bool
If False, the results will contain output rows for each transaction type. If True, the results will contain aggregated experience across all transaction types.
False
full_exposures_only
bool
If True, partially exposed records will be ignored in the results.
True
conf_int
bool
If True, the output will include confidence intervals around the observed utilization rate and any percent_of output columns.
False
conf_level
float
Confidence level for confidence intervals
0.95
col_exposure
str
Name of the column in the data property of expo containing exposures
'exposure'
Attributes
Name
Type
Description
data
polars.polars.DataFrame
A data framethat includes columns for any grouping variables and transaction types, plus the following: trx_n (the number of unique transactions), trx_amt (total transaction amount), trx_flag (the number of observation periods with non-zero transaction amounts), exposure (total exposures), avg_trx (mean transaction amount {trx_amt / trx_flag}), avg_all (mean transaction amount over all records {trx_amt / exposure}), trx_freq (transaction frequency when a transaction occurs {trx_n / trx_flag}), trx_utilization (transaction utilization per observation period {trx_flag / exposure}). If percent_of is provided, the results will also include the sum of any columns passed to percent_of with non-zero transactions (these columns include the suffix _w_trx. - The sum of any columns passed to percent_of), pct_of_{*}_w_trx (total transactions as a percentage of column {*}_w_trx), pct_of_{*}_all (total transactions as a percentage of column {*}).
Notes
If the ExposedDF object is grouped (see the group_by() method), the returned TrxStats object’s data will contain one row per group.
Any number of transaction types can be passed to the trx_types argument, however each transaction type must appear in the trx_types property of the ExposedDF object. In addition, trx_stats() expects to see columns named trx_n_{*} (for transaction counts) and trx_amt_{*} for (transaction amounts) for each transaction type. To ensure .data is in the appropriate format, use the class method ExposedDF.from_DataFrame() to convert an existing data frame with transactions or use add_transactions() to attach transactions to an existing ExposedDF object.
“Percentage of” calculations
The percent_of argument is optional. If provided, this argument must be list with values corresponding to columns in the data property of expo containing values to use as denominators in the calculation of utilization rates or actual-to-expected ratios. Example usage:
In a study of partial withdrawal transactions, if percent_of refers to account values, observed withdrawal rates can be determined.
In a study of recurring claims, if percent_of refers to a column containing a maximum benefit amount, utilization rates can be determined.
Confidence intervals
If conf_int is set to True, the output will contain lower and upper confidence interval limits for the observed utilization rate and any percent_of output columns. The confidence level is dictated by conf_level.
Intervals for the utilization rate (trx_util) assume a binomial distribution.
Intervals for transactions as a percentage of another column with non-zero transactions (pct_of_{*}_w_trx) are constructed using a normal distribution
Intervals for transactions as a percentage of another column regardless of transaction utilization (pct_of_{*}_all) are calculated assuming that the aggregate distribution is normal with a mean equal to observed transactions and a variance equal to:
Var(S) = E(N) * Var(X) + E(X)**2 * Var(N),
Where S is the aggregate transactions random variable, X is an individual transaction amount assumed to follow a normal distribution, and N is a binomial random variable for transaction utilization.
Default removal of partial exposures
As a default, partial exposures are removed from data before summarizing results. This is done to avoid complexity associated with a lopsided skew in the timing of transactions. For example, if transactions can occur on a monthly basis or annually at the beginning of each policy year, partial exposures may not be appropriate. If a policy had an exposure of 0.5 years and was taking withdrawals annually at the beginning of the year, an argument could be made that the exposure should instead be 1 complete year. If the same policy was expected to take withdrawals 9 months into the year, it’s not clear if the exposure should be 0.5 years or 0.5 / 0.75 years. To override this treatment, set full_exposures_only to False.
Alternative class constructor
TrxStats.from_DataFrame() can be used to coerce a data frame containing pre-aggregated experience into a TrxStats object. This is most useful for working with industry study data where individual exposure records are not available.
Convert a data frame containing aggregate transaction experience study results to the TrxStats class.
from_DataFrame() is most useful for working with aggregate summaries of experience that were not created by actxps where individual policy information is not available. After converting the data to the TrxStats class, summary() can be used to summarize data by any grouping variables, and plot() and table() are available for reporting.
Parameters
Name
Type
Description
Default
data
polars.polars.DataFrame | pandas.pandas.DataFrame
A DataFrame containing aggregate transaction study results. See the Notes section for required columns that must be present.
required
conf_int
bool
If True, future calls to summary() will include confidence intervals around the observed utilization rates and any percent_of output columns.
False
conf_level
float
Confidence level used for the Limited Fluctuation credibility method and confidence intervals.
0.95
col_trx_amt
str
Name of the column in data containing transaction amounts.
'trx_amt'
col_trx_n
str
Name of the column in data containing transaction counts.
'trx_n'
col_trx_flag
str
Name of the column in data containing the number of exposure records with transactions.
'trx_flag'
col_exposure
str
Name of the column in data containing exposures.
'exposure'
col_percent_of
str
Name of the column in data containing a numeric variable to use in “percent of” calculations.
None
col_percent_of_w_trx
str
Name of the column in data containing a numeric variable to use in “percent of” calculations with transactions.
None
col_trx_amt_sq
str
Only required when col_percent_of is passed and conf_int is True. Name of the column in data containing squared transaction amounts.
'trx_amt_sq'
start_date
datetime.date | str
Transaction study start date
date(1900, 1, 1)
end_date
datetime.date | str
Transaction study end date
None
Returns
Type
Description
actxps.trx_stats.TrxStats
A TrxStats object
Notes
At a minimum, the following columns are required:
Transaction amounts (trx_amt)
Transaction counts (trx_n)
The number of exposure records with transactions (trx_flag). This number is not necessarily equal to transaction counts. If multiple transactions are allowed per exposure period, trx_flag will be less than trx_n.
Exposures (exposure)
If transaction amounts should be expressed as a percentage of another variable (i.e. to calculate utilization rates or actual-to-expected ratios), additional columns are required:
A denominator “percent of” column. For example, the sum of account values.
A denominator “percent of” column for exposure records with transactions. For example, the sum of account values across all records with non-zero transaction amounts.
If confidence intervals are desired and “percent of” columns are passed, an additional column for the sum of squared transaction amounts (trx_amt_sq) is also required.
The names in parentheses above are expected column names. If the data frame passed to from_DataFrame() uses different column names, these can be specified using the col_* arguments.
start_date, and end_date are optional arguments that are only used for printing the resulting TrxStats object.
Unlike ExposedDF.trx_stats(), from_DataFrame() only permits a single transaction type and a single percent_of column.
Examples
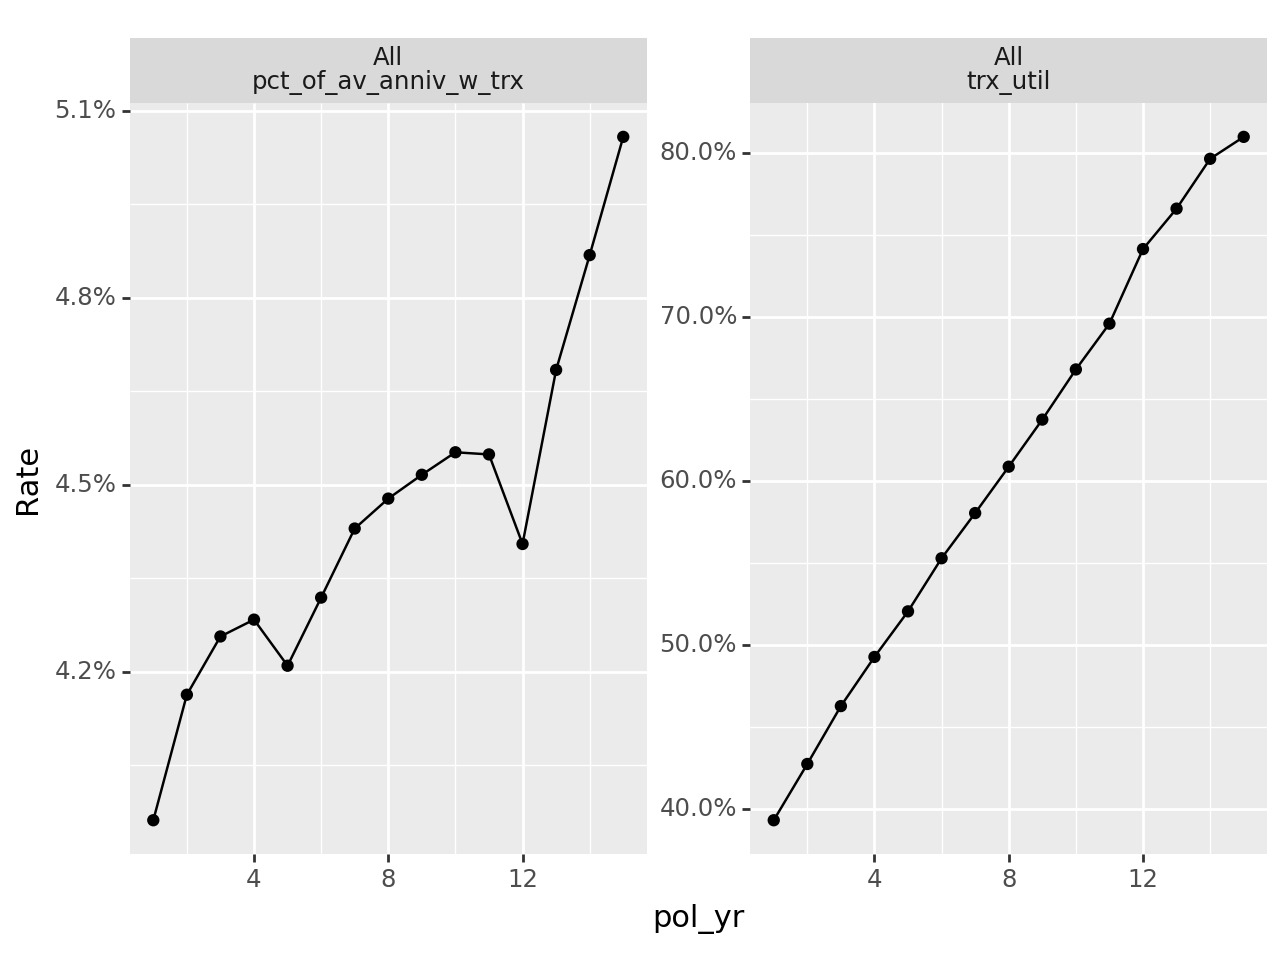
# convert pre-aggregated experience into a TrxStats objectimport actxps as xpimport polars as plagg_sim_dat = xp.load_agg_sim_dat()dat = xp.TrxStats.from_DataFrame( agg_sim_dat.with_columns(pl.col('n').cast(float)), col_exposure="n", col_trx_amt="wd", col_trx_n="wd_n", col_trx_flag="wd_flag", col_percent_of="av", col_percent_of_w_trx="av_w_wd", col_trx_amt_sq="wd_sq", start_date=2005, end_date=2019, conf_int=True)dat# summary by policy yeardat.summary('pol_yr')
ExposedDF.trx_stats() for information on how TrxStats objects are typically created from individual exposure records.
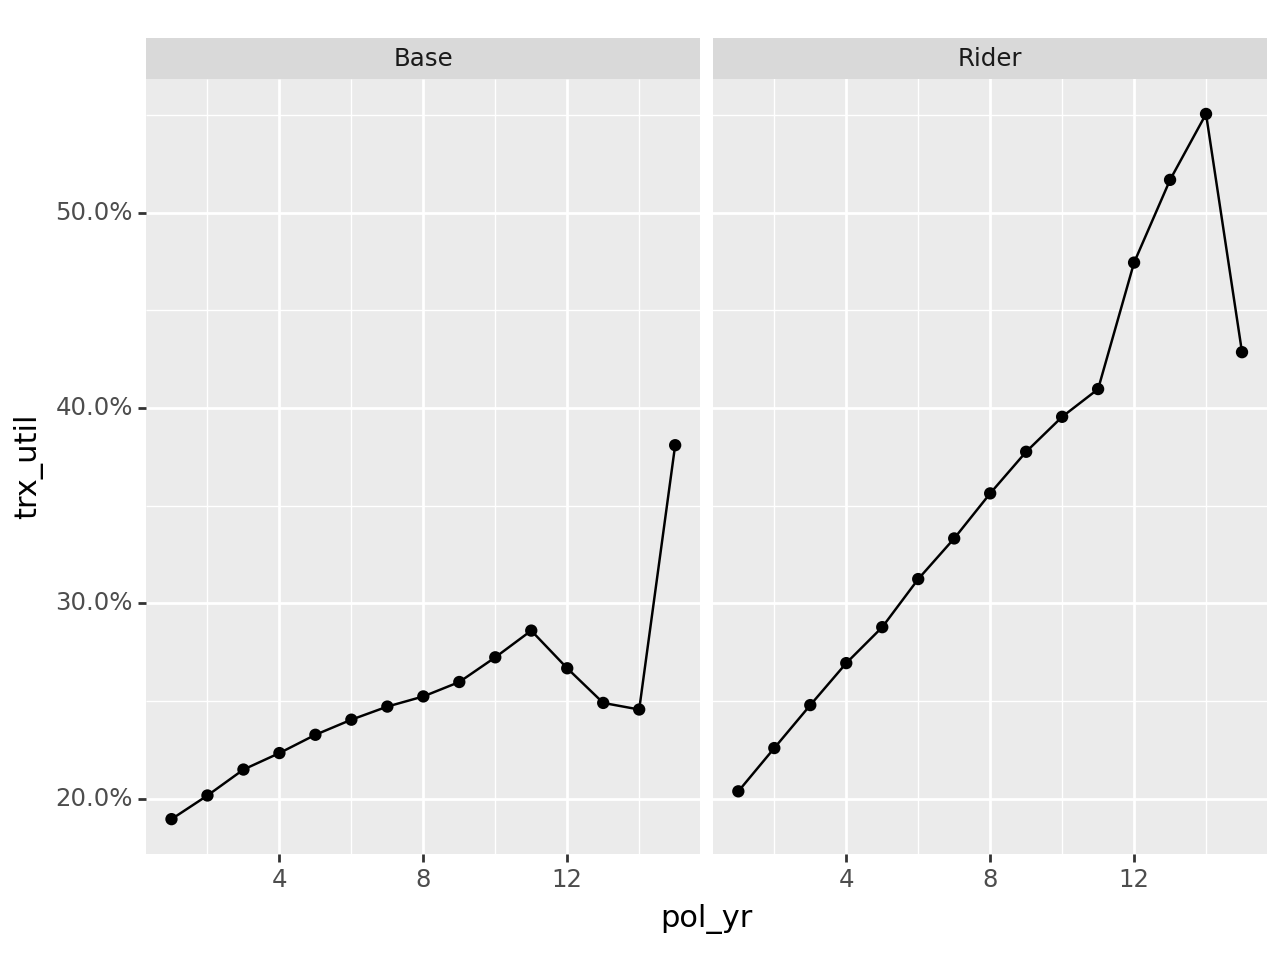
plot
trx_stats.TrxStats.plot(x=None, y='trx_util', color=None, facets=None, mapping=None, scales='fixed', geoms='lines', y_labels=lambda : [f'{v * 100}%' for v in l], y_log10=False, conf_int_bars=False)
Plot transaction study results
Parameters
Name
Type
Description
Default
x
str
A column name in data to use as the x variable. If None, x will default to the first grouping variable. If there are no grouping variables, x will be set to “All”.
None
y
str
A column name in data to use as the y variable.
'trx_util'
color
str
A column name in data to use as the color and fill variables. If None, y will default to the second grouping variable. If there are less than two grouping variables, the plot will not use a color aesthetic.
None
facets
list | str
Faceting variables in data passed to plotnine.facet_wrap(). If None, grouping variables 3+ will be used (assuming there are more than two grouping variables).
None
mapping
plotnine.aes
Aesthetic mapping added to plotnine.ggplot(). NOTE: If mapping is supplied, the x, y, and color arguments will be ignored.
None
scales
str
The scales argument passed to plotnine.facet_wrap().
'fixed'
geoms
‘lines’, ‘bars’, ’points
Type of geometry. If “lines” is passed, the plot will display lines and points. If “bars”, the plot will display bars. If “points”, the plot will display points only.
'lines'
y_labels
callable
Label function passed to plotnine.scale_y_continuous().
lambda l: [f"{v * 100:.1f}%" for v in l]
y_log10
bool
If True, the y-axes are plotted on a log-10 scale.
False
conf_int_bars
bool
If True, confidence interval error bars are included in the plot. This option is only available for utilization rates and any pct_of columns.
False
Notes
If no aesthetic map is supplied, the plot will use the first grouping variable in the groups property on the x axis and trx_util on the y axis. In addition, the second grouping variable in groups will be used for color and fill.
If no faceting variables are supplied, the plot will use grouping variables 3 and up as facets. These variables are passed into plotnine.facet_wrap().
Frequency is represented by utilization rates (trx_util). Severity is represented by transaction amounts as a percentage of one or more other columns in the data ({*}_w_trx). All severity series begin with the prefix “pct_of_” and end with the suffix “_w_trx”. The suffix refers to the fact that the denominator only includes records with non-zero transactions. Severity series are based on column names passed to the percent_of argument in trx_stats(). If no “percentage of” columns exist, this function will only plot utilization rates.
Re-summarize the data while retaining any grouping variables passed to the *by argument.
Parameters
Name
Type
Description
Default
*by
Column names in data that will be used as grouping variables in the re-summarized object. Passing nothing is acceptable and will produce a 1-row experience summary.
()
Returns
Type
Description
actxps.trx_stats.TrxStats
A new TrxStats object with rows for all the unique groups in *by
Convert transaction study results to a presentation-friendly format.
Parameters
Name
Type
Description
Default
fontsize
int
Font size percentage multiplier
100
decimals
int
Number of decimals to display for percentages
1
colorful
bool
If True, color will be added to the the observed utilization rate and “percentage of” columns.
True
color_util
str
ColorBrewer palette used for the observed utilization rate.
'GnBu'
color_pct_of
str
ColorBrewer palette used for “percentage of” columns.
'RdBu'
show_conf_int
bool
If True any confidence intervals will be displayed.
False
decimals_amt
int
Number of decimals to display for amount columns (transaction counts, total transactions, and average transactions)
0
suffix_amt
bool
This argument has the same meaning as the compact argument in great_tables.gt.GT.fmt_number() for amount columns. If False, no scaling or suffixing are applied to amount columns. If True, all amount columns are automatically scaled and suffixed by “K” (thousands), “M” (millions), “B” (billions), or “T” (trillions).
False
rename_cols
str
Key-value pairs where keys are column names and values are labels that will appear on the output table. This parameter is useful for renaming grouping variables that will appear under their original variable names if left unchanged.
None
Notes
Further customizations can be added using great_tables.gt.GT methods. See the great_tables package documentation for more information.